Using Your SBVC Tableau Account
Contents
- Activating and Logging Into Your Account
- Viewing All Available Dashboards
- Set a Start Page
- Download Formats
- Data vs. Crosstab Summary Data
- Comments
- Custom and Default Views
- Email Subscriptions
- Viewing Your Custom Content
Activating and Logging IntoYour Account
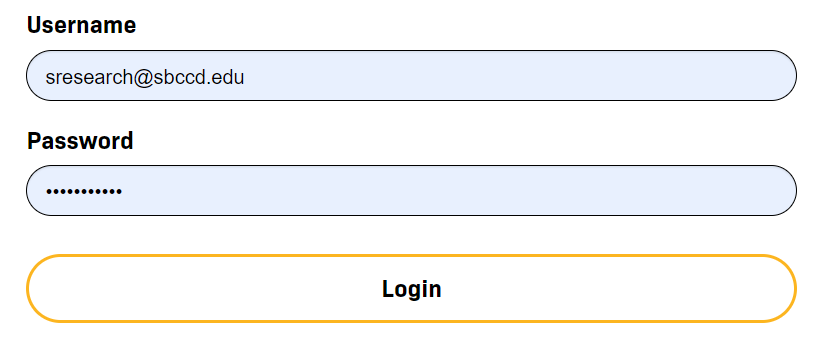
You must visit SBVC's Tableau website to access your account. If you have a Tableau account, you should have received an email from “Tableau Cloud” with an activation link.
Note: There is no way to resend the activation email. Clicking the link in the original email will either take you to active your account or send a new activation link.
To log into your account, you must use @sbccd.edu. If you are prompted for a "Site URI," then you'll need to go back and re-enter your email.
Viewing All Available Dashboards
To view the dashboards available to you, follow these steps:
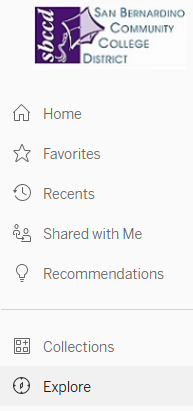
- On the left-hand side of the page, click “Explore”.
- In the drop-down menu at the top of the page, navigate to “All Views” or “All Workbooks”
(recommended)
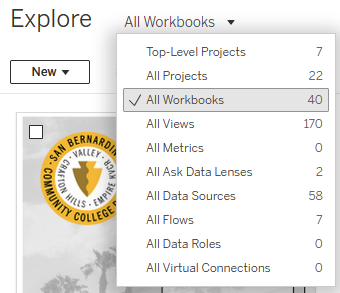
- Views live inside Workbooks
- Workbooks usually have multiple Views
- For example, the Demographics Workbook contains the Views:
- Current Demographics
- Demographics Trends
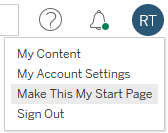
Set a Start Page
You can set any page as your start page.
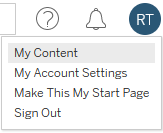
- In the top right-hand corner, click your initials.
- Select “Make This My Start Page”.
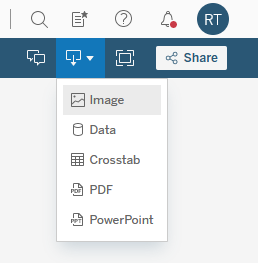
Download Formats
In the top right-hand corner, you can choose to download:
- Images
- Summary Data
- Data
- Crosstab
- PDFs
- PowerPoint Slides
Data vs. Crosstab Summary Data
You can download the summarized data into two formats:
- Data
- Crosstab
Both formats will display the information that is within the tooltip for the selected chart.
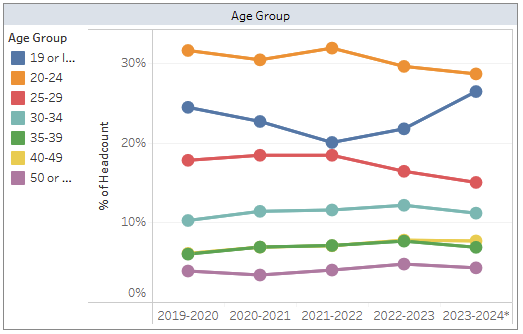
Example
Original Chart: Age Group Trends
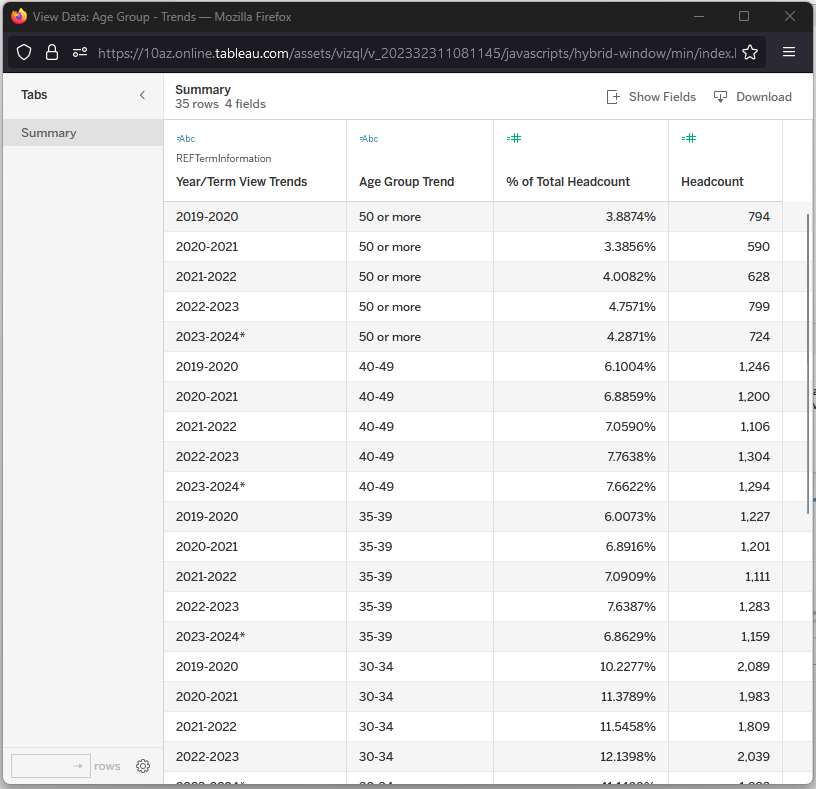
Data Download Option
- Opens a new browser and displays the summary data.
- Can be downloaded as a .csv file.
- Note: Must click a chart before viewing the summary data.
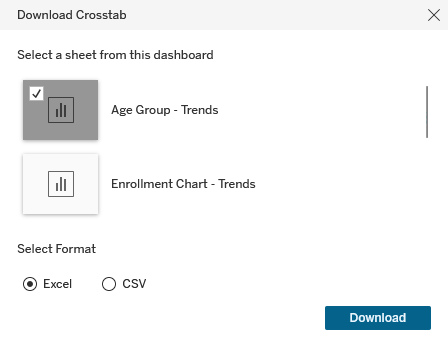
Crosstab Download Option
- Opens a dialog window to select download options.
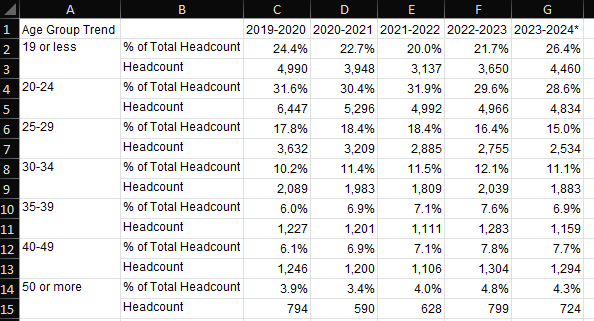
- This format generally retains the structure of the original view (as opposed to the above list-style view).
- Can be downloaded as either an Excel or .csv file.
- Select the chart and format to download.
- View the downloaded data.
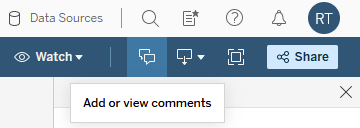
Comments
To leave a comment on a dashboard, click the text bubbles icon in the top right-hand corner.
Note that comments are visible to everyone who has access to that dashboard.
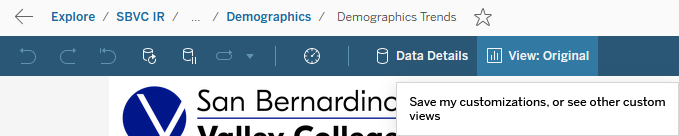
Custom and Default Views
Custom views are shortcuts to dashboards that you have already adjusted (filtered, sorted, etc.) and saved.
- Make any desired changes to the dashboard.
- Click the “View: xxxx” button in the blue bar above the dashboard.
- Adjust the settings in the dialog window and click “Save”.
- Select "Make it my default" to have this view open when first loading the dashboard.
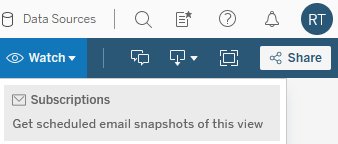
Email Subscriptions
Snapshots of the default view* can be sent to your email on a regular (hourly, daily, weekly, or monthly) basis.
- On the blue bar, click “Watch” with the eye icon.
- Click “Subscriptions”.
- Adjust the settings in the dialog window.
*See the Custom and Default Views section to learn how to set a default view.
Viewing Your Custom Content
You may edit, view, and delete Custom Views and Subscriptions that you have saved.
- Click your initials in the top right-hand corner.
- Click “My Content”.
- Navigate to either “Custom Views” or “Subscriptions”.